Tutorial 3: Automated Annotation of Cell Identities in mIHC Data
In this tutorial, we demonstrate how to use ImmunoPheno to annotate cell identities in a multiplexed IHC dataset using reference data stored in the ImmunoPhenoDB database. Specifically, we consider a human tonsil tissue section that has been profiled with PhenoCycler using a panel of 26 antibodies. For illustration purposes, we will only consider a small portion of the tissue section containing ~118k cells. The data can be found in this link.
[2]:
import pandas as pd
import pickle
import numpy as np
import plotly.express as px
import seaborn as sns
from immunopheno.data_processing import ImmunoPhenoData
from immunopheno.connect import ImmunoPhenoDB_Connect
from immunopheno.plots import plot_filter_metrics
from sklearn.metrics.pairwise import euclidean_distances
We can visualize the spatial location of the cells in the tissue:
[3]:
spat_small = pd.read_csv("codex_small_coordinates.csv", index_col = 0)
fig = px.scatter(spat_small, x="x", y="y").update_traces(marker={'size': 1.0}).update_layout(autosize=False, height=800, width=1000).update_yaxes(scaleanchor="x",
scaleratio=1)
fig.show()
To annotate the dataset, we first create an ImmunoPhenoData object containing the PhenoCycler protein expression matrix
[4]:
ipd = ImmunoPhenoData(protein_matrix = 'codex_small_protein.csv', spreadsheet = "codex_small_spreadsheet.csv")
In addition to the protein expression matrix, we need to provide a spreadsheet containing the RRID identifiers of the monoclonal antibodies used in the experiment. This is because ImmunoPheno will use data from experiments that have used those exact antibodies or, alternatively, monoclonal antibodies from a different vendor but with the same clone ID. The file codex_small_spreadsheet.csv can be used as a template for your own datasets.
We first need to normalize the mIHC data using ImmunoPheno, following the procedure demonstrated in Tutorial 2. For mIHC data, a Gaussian mixture model produces optimal results for most technologies.
[5]:
ipd.fit_all_antibodies(model="gaussian")
Number of 3 component models: 23
Number of 2 component models: 3
Number of 1 component models: 0
[6]:
ipd.normalize_all_antibodies(sig_expr_threshold = 0.80, bg_expr_threshold = 0.10)
WARNING:root: 3758 additional cells have been filtered based on 0.8 sig_expr and 0.1 bg_expr thresholds.
WARNING:root: Total cells filtered: 3758
More information about good practices for normalizing protein expression values using ImmunoPheno can be found in Tutorial 2.
Once we have normalized the protein expression values, we can proceed to annotating the identity of each cell based on the information contained in the ImmunoPhenoDB database.
We first create an instance of ImmunoPhenoDB_Connect, which will allow us to interact with the ImmunoPhenoDB database.
[7]:
cxn = ImmunoPhenoDB_Connect("http://immunopheno.org")
Loading necessary files...
Connecting to database...
Connected to database.
We can see a summary of what is currently in the database using the command db_stats()
[8]:
cxn.db_stats()
Database Statistics
===================
Number of experiments: 18
Number of tissues: 7
Number of cells: 115979
Number of antibodies: 646
Number of antibody targets: 294
Number of antibody clones: 390
Average number of experiments per antibody: 2.68
We can choose to restrict the reference data to experiments using the same tissue type or to specific experiments. In this example, we will use all available data from human tonsils.
[9]:
cxn.which_experiments("tonsil")
[9]:
| idExperiment | nameExp | typeExp | pmid | doi | idBTO | tissue | |
|---|---|---|---|---|---|---|---|
| 0 | 4 | Childhood Hematopoiesis and Immune Development... | CITE | 0 | https://doi.org | BTO:0001387 | tonsil |
| 1 | 5 | Childhood Hematopoiesis and Immune Development... | CITE | 0 | https://doi.org | BTO:0001387 | tonsil |
| 2 | 6 | Childhood Hematopoiesis and Immune Development... | CITE | 0 | https://doi.org | BTO:0001387 | tonsil |
We observe that there are 5 experiments in the ImmunoPhenoDB database with data from human tonsils. The BRENDA tissue ontology ID of the tonsil is BTO:0001387.
We now call run_stvea() to automatically annotate the identity of individual cells in the PhenoCycler data using reference data from the database. You may need to increase the number of chunks depending on the amount of memory available in your computer, as described below.
[10]:
ipd_new = cxn.run_stvea(ipd, idBTO=["BTO:0001387"], num_chunks=4)
Retrieving reference dataset...
Number of antibodies matched from database using clone ID: 26
Imputing missing values...
Number of antibodies imputed: 0
Number of cells imputed: 0
Number of cell types imputed: 0
Remaining number of antibodies after imputation: 26
Remaining number of cells after imputation: 10000
Running STvEA...
Processing chunk of size: 28599
run_cca. Time: 24.067 sec
find_nn_rna Time: 52.528 sec
find_anchor_pairs Time: 4.319 sec
filter_anchors Retained 15800 anchors! Time: 20.376 sec
score_anchors. Time: 5.955 sec
find_integration_matrix Time: 0.005 sec
find_weights Time: 36.687 sec
transform_data_matrix Time: 0.668 sec
Processing chunk of size: 28599
run_cca. Time: 22.747 sec
find_nn_rna Time: 44.936 sec
find_anchor_pairs Time: 4.322 sec
filter_anchors Retained 15970 anchors! Time: 20.079 sec
score_anchors. Time: 6.244 sec
find_integration_matrix Time: 0.008 sec
find_weights Time: 37.281 sec
transform_data_matrix Time: 0.706 sec
Processing chunk of size: 28598
run_cca. Time: 23.672 sec
find_nn_rna Time: 46.266 sec
find_anchor_pairs Time: 4.325 sec
filter_anchors Retained 15888 anchors! Time: 20.037 sec
score_anchors. Time: 6.005 sec
find_integration_matrix Time: 0.008 sec
find_weights Time: 37.487 sec
transform_data_matrix Time: 0.711 sec
Processing chunk of size: 28598
run_cca. Time: 23.664 sec
find_nn_rna Time: 44.971 sec
find_anchor_pairs Time: 4.444 sec
filter_anchors Retained 16645 anchors! Time: 19.947 sec
score_anchors. Time: 6.051 sec
find_integration_matrix Time: 0.006 sec
find_weights Time: 38.931 sec
transform_data_matrix Time: 0.722 sec
map_codex_to_cite: 708.273
transfer_matrix Time: 37.345 sec
Annotation transfer complete.
We have mostly used the default parameters of run_stvea(). This function is memory-intensive, and to execute it on a standard desktop, the data needs to be partitioned into chunks. Having chunks of approximately 10,000-30,000 cells is usually a good approach. Here, we have divided the dataset into num_chunks=4 chunks. We have also restricted the reference data to human tonsils using the argument idBTO=["BTO:0001387"]. In general, using data from the same tissue type will lead to more
accurate annotations, unless there is very limited data from that tissue in the database.
Another option of run_stvea() that is frequently used is parse_option. Here, we have used the default parse_option=1, which uses reference data from monoclonal antibodies from the same clone but potentially different vendors or with different modifications, such as different conjugated oligos or fluorophores, as those in the query mIHC dataset. Setting parse_option=2 is less constraining, requiring only that the antibody protein targets match between the reference and the mIHC
data. On the other hand, parse_option=3 is more stringent, requiring the same exact antibodies (including vendor, etc.) between the reference and mIHC data. We find that parse_option=1 generally offers the best results, except in situations where there is little overlap between the clones used in the mIHC experiment and those present in the database.
run_stvea() also offers the possibility of parallelization for shorter runtime, where the number of cores is specified by the argument num_cores. However, this increases the memory requirements. Finally, run_stvea() includes numerous arguments related to the mapping algorithm that may need to be adjusted for optimal results depending on the specific dataset and available computing resources. These are described in detail in the documentation of ImmunoPheno and in the original STvEA
paper. Increasing the value of “k” parameters, particularly k_transfer_matrix and k_find_anchor, will often increase the number of anchors and the accuracy of the annotations at the expense of a substantially larger runtime and memory requirements. Generally, for chunks of 10,000-30,000 cells, it is desirable to obtain at least ~10,000 anchors. For large datasets, we recommend experimenting with different parameter options, monitoring memory
usage, on a subset of the data before running run_stvea() on the entire dataset.
The cell annotations are stored in the field labels of the ImmunoPheno object
[11]:
print(ipd_new.labels["celltype"].value_counts().to_string())
celltype
naive B cell 45896
central memory CD4-positive, alpha-beta T cell 13377
naive thymus-derived CD4-positive, alpha-beta T cell 7485
T follicular helper cell 5740
CD8-positive, alpha-beta T cell 5607
blood vessel endothelial cell 5547
memory B cell 4946
bronchial smooth muscle cell 4871
centroblast 4689
CD4-positive, CD25-positive, alpha-beta regulatory T cell 3525
plasmacytoid dendritic cell 2738
conventional dendritic cell 2342
epithelial cell 1659
follicular dendritic cell 1104
monocyte 942
mesenchymal stem cell 849
naive thymus-derived CD8-positive, alpha-beta T cell 847
endothelial cell of lymphatic vessel 745
centrocyte 392
central memory CD8-positive, alpha-beta T cell 330
chondrocyte 223
innate lymphoid cell 198
plasma cell 99
CD16-negative, CD56-bright natural killer cell, human 94
tonsil germinal center B cell 57
CD4-positive, alpha-beta T cell 41
effector memory CD8-positive, alpha-beta T cell 19
vascular associated smooth muscle cell 17
mast cell 7
natural killer cell 5
double negative thymocyte 2
effector memory CD4-positive, alpha-beta T cell 1
Cell assignments are based on the cell type that has the highest probability for each cell. The field cell_type_prob contains a table with the cell-type probabilities for each cell. From this table, we can observe that some cell subtypes are harder to distinguish than others
[12]:
sns.clustermap(np.log(1+euclidean_distances(ipd_new.cell_type_prob.transpose())), xticklabels = ipd_new.cell_type_prob.transpose().index, yticklabels = ipd_new.cell_type_prob.transpose().index)
[12]:
<seaborn.matrix.ClusterGrid at 0x76784e8ce4d0>
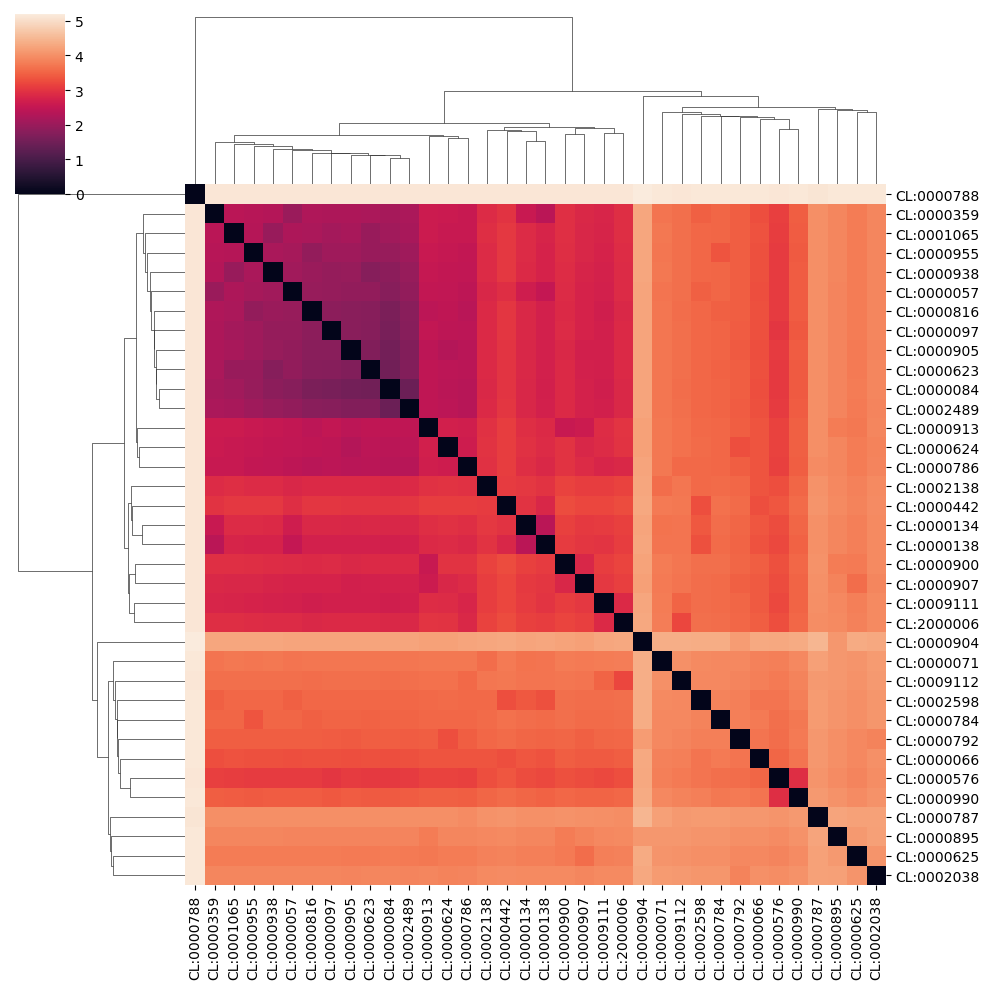
For example, we observe that distinguishing Natural Killer cells (CL:0000623) from CD16-negative CD56-high Natural Killer cells (CL:0000938) is difficult, as the former contains the latter. However, distinguishing plasmacytoid dendritic cells (CL:0000784) from all the other cell types is much easier. ImmunoPheno quantifies the uncertainty in the cell type assignment for each cell by computing the entropy (in base 2) of the vector of cell type probabilities for each cell. If a cell is
annotated with a specific cell type with probability 1, the entropy for that cell will be zero, while cells with more uncertain assignments will have larger entropy. The maximum possible value of the entropy is log2(N), with N being the number of cell types in the dataset. The field entropies of the ImmunoPheno object contains the entropy of the cell assignments for each cell.
Another metric that is informative about the quality of each annotation is the ratio between D1 and D2, where D1 is the average distance in the consolidated protein space between the mIHC dataset query cell and the nearest k_transfer_matrix neighbors from the reference data, and D2 is the average pairwise distance in the consolidated protein space between the nearest k_transfer_matrix neighbors in the reference dataset, where k_transfer_matrix is specified in the call to
run_stvea() (default k_transfer_matrix=40). A smaller value of the ratio indicates a better mapping. The field distance_ratios of the ImmunoPheno object contains the ratio between D1 and D2 for each cell.
The distributions of entropies and D1/D2 ratios can be visualized using plot_filter_metrics()
[13]:
plot_filter_metrics(ipd_new)
As detailed above, the quality of the annotations can be increased by taking larger values of k_transfer_matrix and k_find_anchor in run_stvea(), and this should be reflected in these metrics.
We can filter out poor-quality annotations based on these two quantities using filter_labels(). In this example, we will filter out cells with D1/D2 > 2 and entropy > 3
[14]:
ipd_new = cxn.filter_labels(ipd_new, distance_ratio = True, entropy = True, distance_ratio_threshold=2, entropy_threshold = 3)
WARNING:root:Parameters for localization will be ignored because 'localization' is set to False.
WARNING:root:Parameters for merging will be ignored because 'merging' is set to False.
Performing nearest neighbor distance ratio filtering...
Number of cells renamed to 'Not Assigned': 1184
epithelial cell (CL:0000066): 1
blood vessel endothelial cell (CL:0000071): 37
mesenchymal stem cell (CL:0000134): 15
vascular associated smooth muscle cell (CL:0000359): 2
CD8-positive, alpha-beta T cell (CL:0000625): 85
memory B cell (CL:0000787): 9
naive B cell (CL:0000788): 536
naive thymus-derived CD4-positive, alpha-beta T cell (CL:0000895): 106
naive thymus-derived CD8-positive, alpha-beta T cell (CL:0000900): 35
central memory CD4-positive, alpha-beta T cell (CL:0000904): 273
T follicular helper cell (CL:0002038): 52
bronchial smooth muscle cell (CL:0002598): 33
Distance_ratio filtering complete.
Performing cell type entropy filtering...
Number of cells renamed to 'Not Assigned': 9770
epithelial cell (CL:0000066): 128
blood vessel endothelial cell (CL:0000071): 1849
mast cell (CL:0000097): 4
mesenchymal stem cell (CL:0000134): 288
chondrocyte (CL:0000138): 54
vascular associated smooth muscle cell (CL:0000359): 5
follicular dendritic cell (CL:0000442): 90
monocyte (CL:0000576): 76
natural killer cell (CL:0000623): 2
CD4-positive, alpha-beta T cell (CL:0000624): 10
CD8-positive, alpha-beta T cell (CL:0000625): 663
plasmacytoid dendritic cell (CL:0000784): 251
plasma cell (CL:0000786): 49
memory B cell (CL:0000787): 280
naive B cell (CL:0000788): 1403
CD4-positive, CD25-positive, alpha-beta regulatory T cell (CL:0000792): 403
naive thymus-derived CD4-positive, alpha-beta T cell (CL:0000895): 588
naive thymus-derived CD8-positive, alpha-beta T cell (CL:0000900): 153
central memory CD4-positive, alpha-beta T cell (CL:0000904): 1905
effector memory CD4-positive, alpha-beta T cell (CL:0000905): 1
central memory CD8-positive, alpha-beta T cell (CL:0000907): 86
effector memory CD8-positive, alpha-beta T cell (CL:0000913): 11
CD16-negative, CD56-bright natural killer cell, human (CL:0000938): 21
conventional dendritic cell (CL:0000990): 173
innate lymphoid cell (CL:0001065): 49
T follicular helper cell (CL:0002038): 277
endothelial cell of lymphatic vessel (CL:0002138): 227
double negative thymocyte (CL:0002489): 2
bronchial smooth muscle cell (CL:0002598): 668
centrocyte (CL:0009111): 10
centroblast (CL:0009112): 42
tonsil germinal center B cell (CL:2000006): 2
Entropy filtering complete.
In addition, ImmunoPheno can identify and filter out low-quality annotations by looking at the localization of the annotations in the mIHC protein expression space. Cells annotated in the same manner but with inconsistent protein expression profiles (and therefore randomly scattered in the protein expression space) will be removed. Additionally, different annotations that cannot be separated in the protein expression space are merged into a single annotation.
[15]:
ipd_new = cxn.filter_labels(ipd_new, localization = True, merging = True)
WARNING:root:Parameters for distance_ratio will be ignored because 'distance_ratio' is set to False.
WARNING:root:Parameters for entropy will be ignored because 'entropy' is set to False.
Performing localization...
Downsampling dataset to 5000 cells...
Calculating pairwise distances between cells...
Generating cell graph...
Conducting fisher exact test for each cell type...
Number of cell types to rename: 4
epithelial cell (CL:0000066): 1530
vascular associated smooth muscle cell (CL:0000359): 10
monocyte (CL:0000576): 866
innate lymphoid cell (CL:0001065): 149
Renaming 2555 cells with 'Not Assigned' label...
Renamed 2555 cells.
Localization complete.
Performing merging...
Replacing all cells of CL:0000623 with CL:0000938
Number of cell types merged: 0
Merging complete.
Filtered out cells are labeled as Not Assigned
[16]:
print(ipd_new.labels["celltype"].value_counts().to_string())
celltype
naive B cell 43957
Not Assigned 13509
central memory CD4-positive, alpha-beta T cell 11199
naive thymus-derived CD4-positive, alpha-beta T cell 6791
T follicular helper cell 5411
CD8-positive, alpha-beta T cell 4859
memory B cell 4657
centroblast 4647
bronchial smooth muscle cell 4170
blood vessel endothelial cell 3661
CD4-positive, CD25-positive, alpha-beta regulatory T cell 3122
plasmacytoid dendritic cell 2487
conventional dendritic cell 2169
follicular dendritic cell 1014
naive thymus-derived CD8-positive, alpha-beta T cell 659
mesenchymal stem cell 546
endothelial cell of lymphatic vessel 518
centrocyte 382
central memory CD8-positive, alpha-beta T cell 244
chondrocyte 169
CD16-negative, CD56-bright natural killer cell, human 76
tonsil germinal center B cell 55
plasma cell 50
CD4-positive, alpha-beta T cell 31
effector memory CD8-positive, alpha-beta T cell 8
mast cell 3
The location of the annotated cells in the tissue section recapitulates the known architecture of human tonsils,
[19]:
spat_small.loc[ipd_new.labels.index, "celltype"] = ipd_new.labels["celltype"]
fig = px.scatter(spat_small, x="x", y="y", color="celltype",
color_discrete_sequence=px.colors.qualitative.Vivid_r).update_traces(marker={'size': 1.4}).update_layout(autosize=False, height=1000, width=1500).update_yaxes(scaleanchor="x",
scaleratio=1)
fig.show()
Finally, we can serialize the annotated ImmunoPheno object into a pickle file for future use
[44]:
## To save the ImmunoPheno object into a pickle file
with open('ipd_new_pickle', 'wb') as sample:
pickle.dump(ipd_new, sample)
## To load the ImmunoPheno object from the pickle file:
# with open('ipd_new_pickle', 'rb') as sample:
# ipd_new = pickle.load(sample)